ERP Med module
Dashboards: the clinic's activity at a glance
The dashboard brings together thirteen views fed by the other modules: finance, activity, output, patients and billing. Each can be filtered by period and shown as bars, lines, pie charts or a pivot table.
The figures come straight from the data entered at reception, on the wards, in the laboratory and at the cash desk: you look them up instead of rebuilding them. We also add the indicators your management wants to track, built on the data already in ERP Med.
Activity
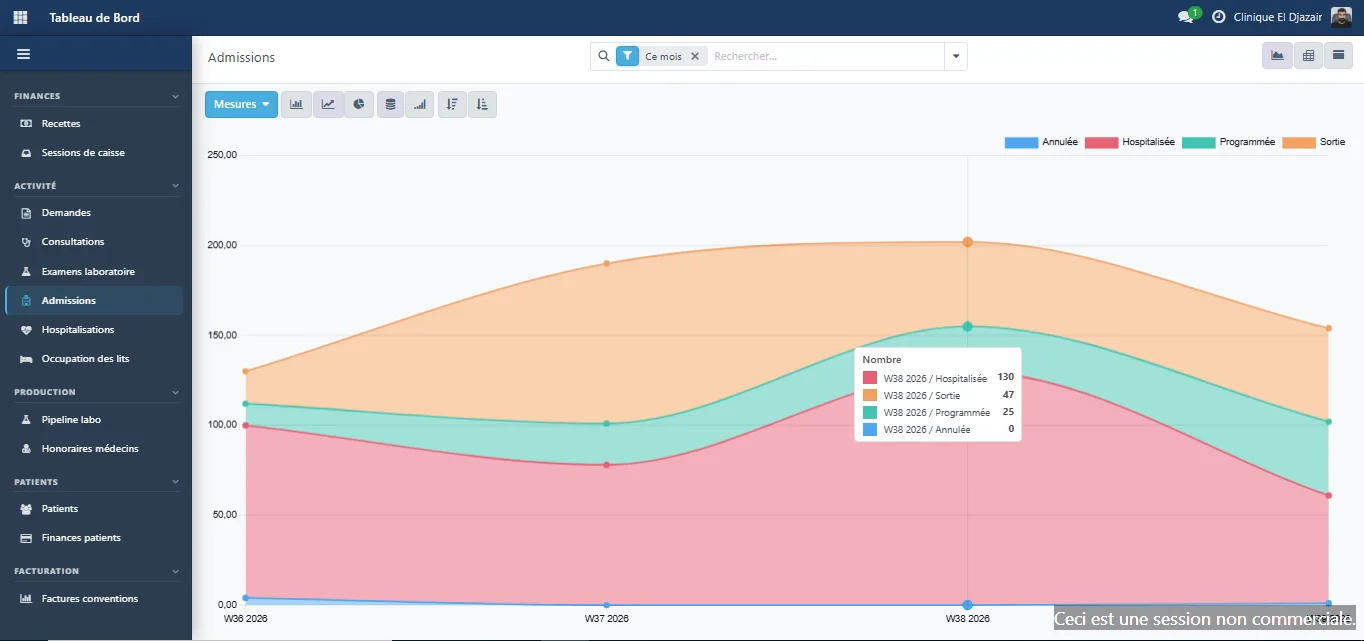
Admissions, week by week
The admissions trend is shown by status: scheduled, admitted, discharged and cancelled.
Output
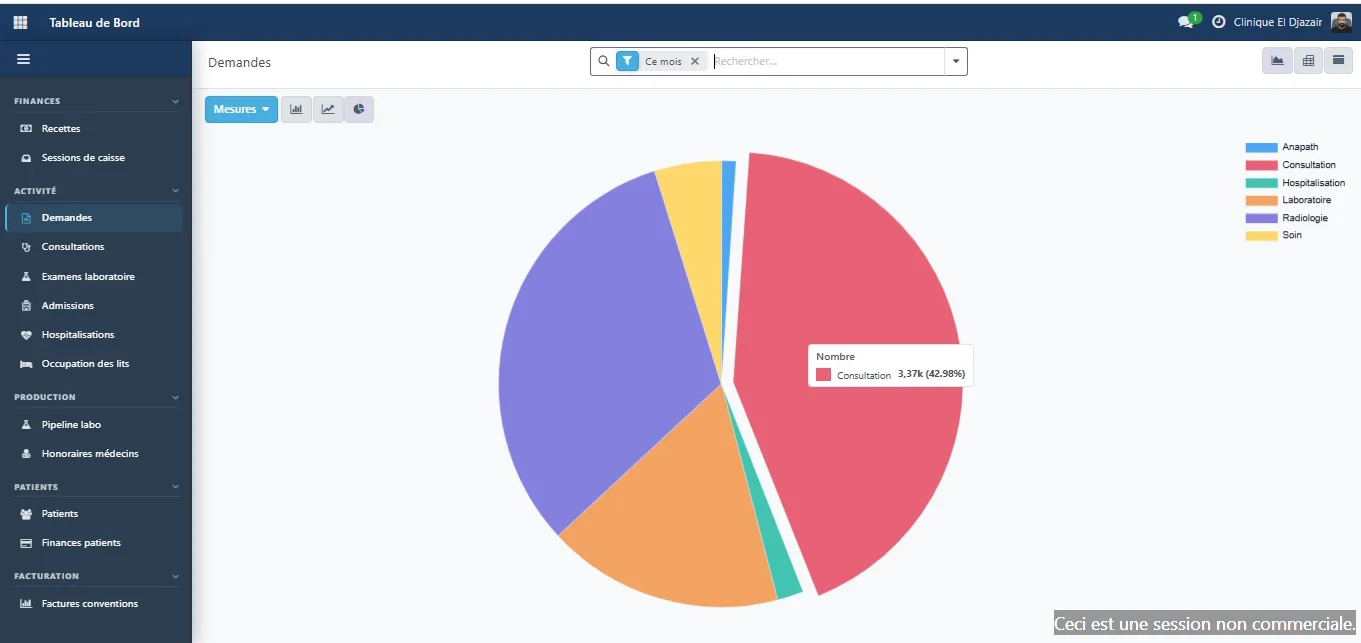
This month's requests, by service type
Consultation, radiology, laboratory, care, inpatient stay, pathology: this month's requests broken down in a single chart.
Patients
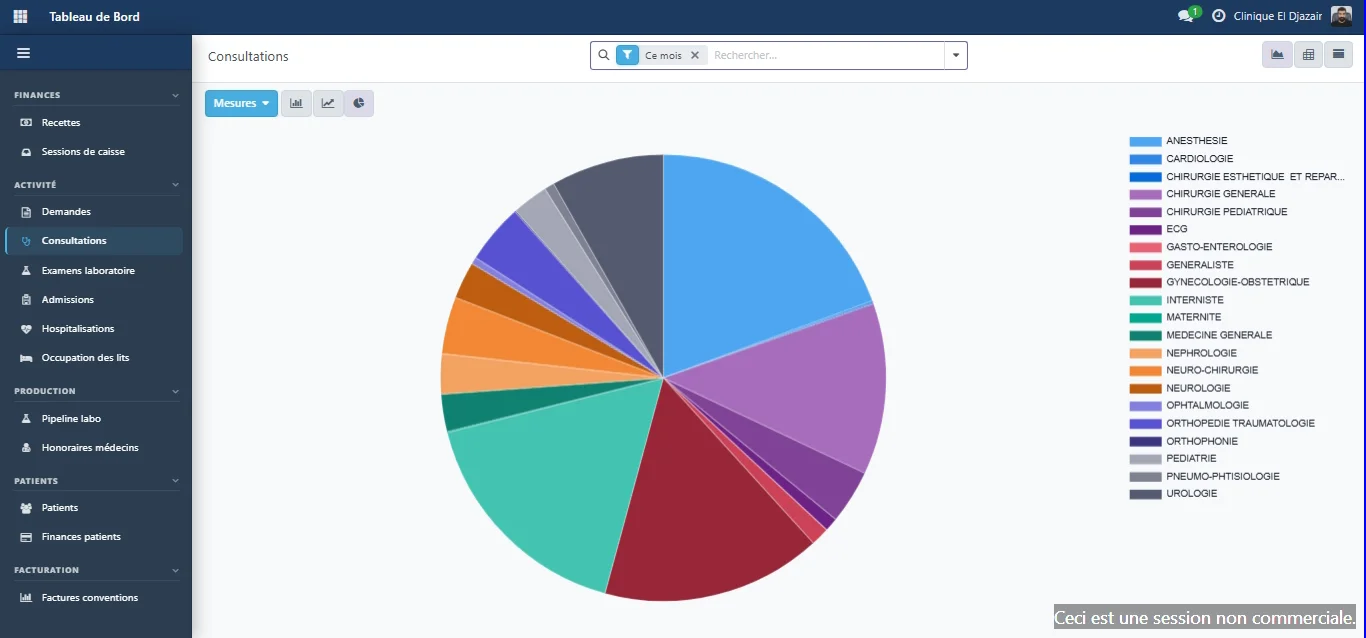
This month's consultations, by specialty
The breakdown of consultations by specialty for the current month.
ERP Med
The other modules, on the same patient record
- Reception & admissionsPatient registration, service requests and admissions tracked through to discharge. — Explore the Reception & admissions module
- Inpatient careWard arrivals, bed plan and care sheet, linked to the record of the stay. — Explore the Inpatient care module
- LaboratoryTest dispatching, result entry and biological validation. — Explore the Laboratory module
- Cash deskPayments calculated by the system, cash sessions with variance control. — Explore the Cash desk module
- Billing & agreementsPartner insurers, covered shares and agreement invoices. — Explore the Billing & agreements module
- Practitioner feesFee scales per procedure and role, fees calculated on collections. — Explore the Practitioner fees module
- InventoryProducts and stock movements, consumption tracked per ward and per patient. — Explore the Inventory module
- Fixed assetsA single register of equipment and assets, with their history. — Explore the Fixed assets module
A demo built on your own cases.
Your services, your insurer agreements and your fee rules, run through ERP Med: judge it on the evidence.